Crashing Special Case - Multiple (Parallel) Critical Paths
Watch videoAs we have understood the method of crashing in the video, let us move to the special case of Crashing. (If you have not watched the video yet, click on the "Watch Video" button above and clear your doubts about the method now.)
As title suggest, we will discuss the numerical which will have more than 1 critical path, i.e. Multiple Critical Paths.
Many may get confused in crashing of such problem which have more than 1 critical paths, as if you try to solve that you may find that:
- You are crashing a critical activity, but your project duration does not change.
- This is happening due to the other critical path (parallel critical path), as it by crashing you are trying to reduce the time, whereas parallel critical path is the longest one and it will not allow you to reduce the time.
So now, what's the solution to that?
Here is the very simple and logical solution to the same problem. We will understand now that, what we should do to tackle such problem!
Let us start by considering the following problem:
Numerical:
Table below shows the normal time & cost and crash time & cost of the various activities in a project. Find the optimum duration and minimum project cost, assuming the indirect cost of the project as Rs. 200/week.
| Activity | Normal Time(weeks) | Normal Cost(Rs.) | Crash Time(weeks) | Crash Cost(Rs.) |
|---|---|---|---|---|
| 1-2 | 7 | 700 | 4 | 50 |
| 1-3 | 5 | 500 | 3 | 100 |
| 1-4 | 8 | 600 | 5 | 200 |
| 2-5 | 9 | 800 | 7 | 225 |
| 3-5 | 5 | 700 | 3 | 150 |
| 3-6 | 6 | 1100 | 5 | 200 |
| 4-6 | 7 | 1200 | 5 | 125 |
| 5-7 | 2 | 400 | 1 | 100 |
| 6-7 | 3 | 500 | 2 | 350 |
| Total: | 6500 |
Solution:
As per the look of the numerical, it looks simple to solve, and believe me, it is if you follow this simple method.
Starting by constructing the Network Diagram and finding project completion time using Critical Path Method.
If you don't know about Critical Path method (CPM), then check out - CPM Video.
Network Diagram:
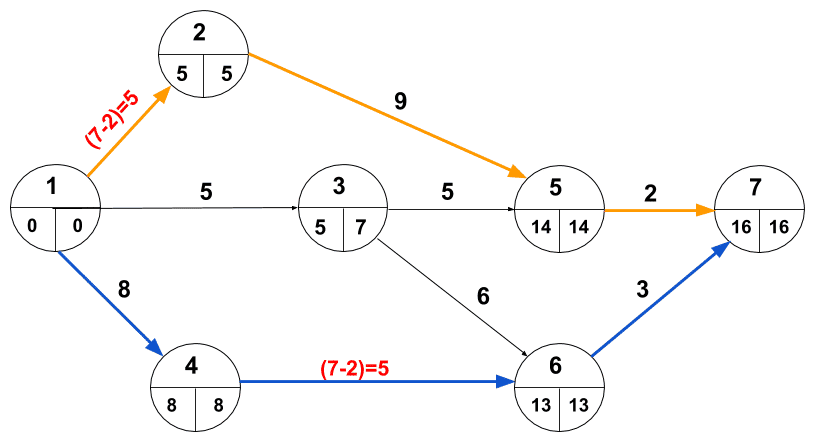
 Network Diagram with CPM
AS we can see from the netwrok diagram, we have more than one critical path generated, i.e. here we have two critical paths as marked in orange and blue colour, as follows:
Critical Paths:
1-2-5-7 : Project completion 18 weeks
1-4-6-7 : Project completion 18 weeks
As we can see above, both paths have same completion duration and the longest one as well, so both are critical paths. Such equal critical paths are called as Parallel Critical Paths.
Project completion time and cost:
Now,
Let us move to crashing of this numerical;
Crashing:
Evaluating cost slope for different activites:
In examination you can only copy acivites in the first column and add second column for the cost slope. For better understanding, we are providing whole table again with the addition of the last column of cost slope. Same type examination tactics are always illustrating in videos provided by Education Lessons.
| Activity | Normal Time(weeks) | Normal Cost(Rs.) | Crash Time(weeks) | Crash Cost(Rs.) | Cost Slope |
|---|---|---|---|---|---|
| 1-2 | 7 | 700 | 4 | 50 | 50 |
| 1-3 | 5 | 500 | 3 | 100 | 100 |
| 1-4 | 8 | 600 | 5 | 200 | 200 |
| 2-5 | 9 | 800 | 7 | 225 | 225 |
| 3-5 | 5 | 700 | 3 | 150 | 150 |
| 3-6 | 6 | 1100 | 5 | 200 | 200 |
| 4-6 | 7 | 1200 | 5 | 125 | 125 |
| 5-7 | 2 | 400 | 1 | 100 | 100 |
| 6-7 | 3 | 500 | 2 | 350 | 350 |
| Total: | 6500 |
As you can see, cost slopes for different activities are evaluated in the table. Also, critical path activities are marked with their path colours (i.e. Orange and Blue).
In examination, for bifurcation of critical path activities use rectangular border around the activity for the first path(as mentioned in the video) and elliptical border for the other. You can use something else on your own, but use such shapes that can make different critical path activities differentiable.
We are avoiding re-writing of the table to save time in examination. Always try to complete such lengthy numerical in a single table.
Now, as per method we will be selecting the critical activity with the lowest cost slope. So, we have activity 1-2 with the lowest cost slope of 50 Rs.
So, crashing activity 1-2 directly by 4 weeks.
But wait, think once, if we try to do so, what will be result ?
We will find that, the project completion time will remain the same. This is happening because we have another parallel critical path.
We are trying to reduce total project completion time upto 3 weeks by crashing activity 1-2 directly by 4 weeks.
Here, I mentioned that we are going to reduce the completion time upto 3 weeks, because if we take the difference of normal & crash time of activity 1-2 is (7-4) = 3.
Instead of that, if try to crash this activity by step-by-step crashing, then also same problem persists.
So, I can conclude logically that:
- We are facing this problem while crashing only due to the other parallel critical path.
- So, if we carried out parallel crashing, then we can avoid this problem. This is because both paths will be crashed together, and both will reduce the duration.
Okay, so we have solution to problem now. And, also we are going to do the same now.
Parallel Crashing:
We have two following critical paths:
1-2-5-7 : Project completion 18 weeks
1-4-6-7 : Project completion 18 weeks
Already we have evaluated that, minimum cost for path 1-2-5-7 is of 1-2 i.e, 50 Rs.
Similarly, we have to find out minimum cost slope for path 1-4-6-7, as we are going to crash both paths together (parallel crashing).
We have activity 4-6 with minimum cost slope of Rs. 125 from 1-4-6-7.
Now, let us mark this the table as follows:
| Activity | Normal Time(weeks) | Normal Cost(Rs.) | Crash Time(weeks) | Crash Cost(Rs.) | Cost Slope |
|---|---|---|---|---|---|
| 1-2 | 7 | 700 | 4 | 50 | 50 # |
| 1-3 | 5 | 500 | 3 | 100 | 100 |
| 1-4 | 8 | 600 | 5 | 200 | 200 |
| 2-5 | 9 | 800 | 7 | 225 | 225 |
| 3-5 | 5 | 700 | 3 | 150 | 150 |
| 3-6 | 6 | 1100 | 5 | 200 | 200 |
| 4-6 | 7 | 1200 | 5 | 125 | 125 # |
| 5-7 | 2 | 400 | 1 | 100 | 100 |
| 6-7 | 3 | 500 | 2 | 350 | 350 |
| Total: | 6500 |


You have to use the last table we created, and mark in that only. I am copying again so that you can understand here only, without scrolling above.
As you can see, I have use "#" mark to mark this minimum cost slopes. Let us now crash this both paths simultaneously.
We have crash time of 4 weeks for activity 1-2 with normal time of 7 weeks.
And for activity 4-6 , crash time is 5 weeks and normal time is 7 weeks
So now, question is what crash time we are gonna use, 4 or 5 weeks ?
We will use 5 weeks here. But why ???
Let me explain this:
We understand this using step-by-step crashing. If we crash both paths by 1 week, then we will find that 1 week is reduced in project duration.
As we know, the number days/weeks we are gonna crash, same will be the reduction in the total project duration.
Again, we can crash both paths by 1 week. But now, question arises - Upto how many times we can crash an activity, using step-by-step crashing ? What is the limit ?
Answer to these questions is: As I mentioned in step-by-step crashing, you can crash an activity by steps upto provided crash time.
For example, here we have:
- For activity 4-6 , crash time is 5 weeks .
- In the first step, we will reduce its normal time by 1 week, i.e. (7-1) = 6 weeks.
- Again crashing it by 1 week, i.e. (6-1) = 5 weeks.
- And now, we can see that the activity 4-6 is reduce to 5 weeks and which equal to the crash time so provided.
- So, after this we cannot crash this activity as we don't know the cost applicable to reduction in 1 or more weeks than 5 weeks. So, we stop step-by-step crashing there.
As you can see, it is very lengthy to follow step-by-step crashing in examination. So, we should go for the direct method as illustrated in the Crashing video, but with a simple trick.
We will add a additional column to our existing table as follows:
| Activity | Normal Time(weeks) | Normal Cost(Rs.) | Crash Time(weeks) | Crash Cost(Rs.) | Cost Slope | Crashing limit |
|---|---|---|---|---|---|---|
| 1-2 | 7 | 700 | 4 | 50 | 50 # | (7-4)=3 |
| 1-3 | 5 | 500 | 3 | 100 | 100 | |
| 1-4 | 8 | 600 | 5 | 200 | 200 | |
| 2-5 | 9 | 800 | 7 | 225 | 225 | |
| 3-5 | 5 | 700 | 3 | 150 | 150 | |
| 3-6 | 6 | 1100 | 5 | 200 | 200 | |
| 4-6 | 7 | 1200 | 5 | 125 | 125 # | (7-5)=2 |
| 5-7 | 2 | 400 | 1 | 100 | 100 | |
| 6-7 | 3 | 500 | 2 | 350 | 350 | |
| Total: | 6500 |
Crashing limit: As we have understand from the concept of step-by-step crashing, we can reduce the duration of a particular acitivity upto given crash time, using crashing. So, the difference of Normal time and Crash time is the crash limit for a particular acitvity. i.e;
As you can see, crashing limit is already added for the required acitivities. We get;
Crashing limit as:
3 for 1-2
2 for 4-6
So, we will go with the minimum limit, so that both the paths will have same reduction in the duration.
Note that: You cannot use maximum limit. As you can see above, if we are gonna use maximum limit, then we are not able to define the cost of reduction in 1 extra week of activity 4-6.
Iteration 1:
Crashing both activities 1-2 & 4-6 directly by 2 weeks.
As you can see in the following table, I have added vertical bars "|" equal to crashing limit in the last column.
This is because, we have crashed activity based on minimum crashing limit (i.e 2), but we can still take the advantage of 1 week crashing of 1-2 with minimum cost of 50 in the next iteration.
| Activity | Normal Time(wk) | Normal Cost(Rs.) | Crash Time(wk) | Crash Cost(Rs.) | Cost Slope | Crashing limit |
|---|---|---|---|---|---|---|
| 1-2 | 7 | 700 | 4 | 50 | 50 ## | 3 | | | |
| 1-3 | 5 | 500 | 3 | 100 | 100 | |
| 1-4 | 8 | 600 | 5 | 200 | 200 | |
| 2-5 | 9 | 800 | 7 | 225 | 225 | |
| 3-5 | 5 | 700 | 3 | 150 | 150 | |
| 3-6 | 6 | 1100 | 5 | 200 | 200 | |
| 4-6 | 7 | 1200 | 5 | 125 | 125 # | 2 | | |
| 5-7 | 2 | 400 | 1 | 100 | 100 | |
| 6-7 | 3 | 500 | 2 | 350 | 350 | |
| Total: | 6500 |
New network diagram formed as follows:
As we can see in the above diagram, both activites are crashed for 2 weeks. And, the project completion time is also reduced by 2 weeks, i.e. 16 weeks.
Critical Paths:
1-2-5-7 : Project completion 16 weeks
1-4-6-7 : Project completion 16 weeks
Also,
Here, we added cost of reduction by 2 weeks for both activities, because if we crash single activity we cannot reduce the total time of the project.
So, we have pay 100 Rs. to reduce time of acitvity 1-2 by 2 weeks, as well as we ahve to pay 250 Rs. to reduce time of activity 4-6 by 2 weeks.
Let us move to next step of crashing the same way.
Iteration 2:
Always take advantage of minimum cost slope, and crash the activity upto the limit to get minimum cost of the project.
As you can see, I have strike out the number of bars from crashing limit against 1-2 & 4-6. Strike number of weeks you have already crashed, i.e. 2 strikes for both activities.
So, I will now take advantage of 1 week of activity 1-2 .
| Activity | Normal Time(wk) | Normal Cost(Rs.) | Crash Time(wk) | Crash Cost(Rs.) | Cost Slope | Crashing limit |
|---|---|---|---|---|---|---|
| 1-2 | 7 | 700 | 4 | 50 | 50 ## | 3 |
| 1-3 | 5 | 500 | 3 | 100 | 100 | |
| 1-4 | 8 | 600 | 5 | 200 | 200 ## | 3 | | | |
| 2-5 | 9 | 800 | 7 | 225 | 225 | |
| 3-5 | 5 | 700 | 3 | 150 | 150 | |
| 3-6 | 6 | 1100 | 5 | 200 | 200 | |
| 4-6 | 7 | 1200 | 5 | 125 | 125 # | 2 |
| 5-7 | 2 | 400 | 1 | 100 | 100 | |
| 6-7 | 3 | 500 | 2 | 350 | 350 | |
| Total: | 6500 |
Now, for this next iteration while we are selecting minimum cost for both paths, I will select as following:
Crashing activity 1-2 by 1 week for critical path 1-2-5-7.
And,
Crashing activity 1-4 by 1 week for critical path 1-4-6-7 .
Selecting crashing by 1 week, as it minimum crashing limit among 1-2 & 1-4.
Also, marking "##" for the second iteration of parallel crashing.
New network diagram formed as follows:

So, we get;
We can conclude that, by this is iteration-2 the Project cost increases than the last iteration-1.
So, we get;
Check another miscellaneous example about crashing here - Crashing Special Case - Indirect cost less than Crash Cost
Suggested Notes:
Modified Distribution Method (MODI) | Transportation Problem | Transportation Model
Stepping Stone | Transportation Problem | Transportation Model
Vogel’s Approximation Method (VAM) | Method to Solve Transportation Problem | Transportation Model
Transportation Model - Introduction
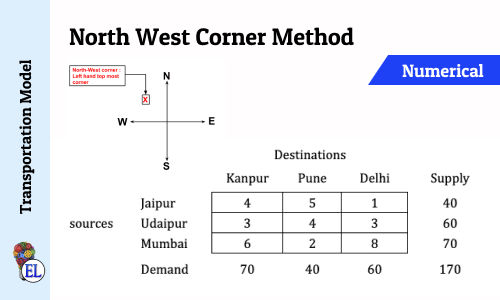
North West Corner Method | Method to Solve Transportation Problem | Transportation Model
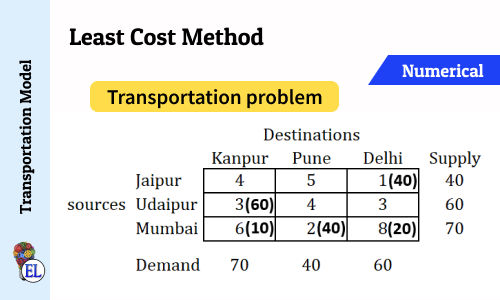
Least Cost Method | Method to Solve Transportation Problem | Transportation Model
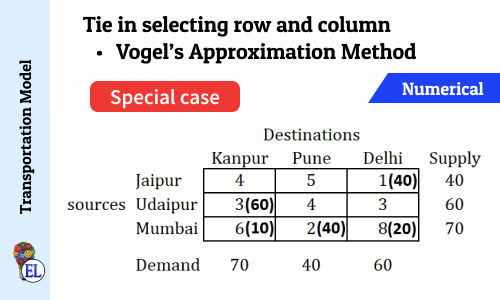
Tie in selecting row and column (Vogel's Approximation Method - VAM) | Numerical | Solving Transportation Problem | Transportation Model
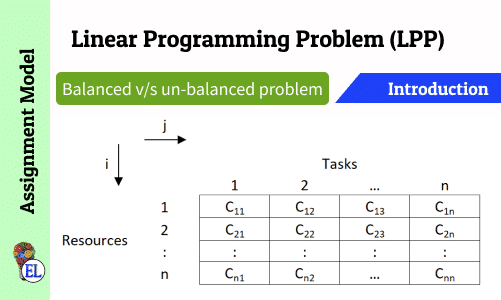
Assignment Model | Linear Programming Problem (LPP) | Introduction
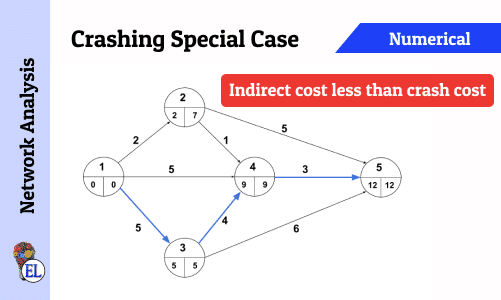
Crashing Special Case - Indirect cost less than Crash Cost
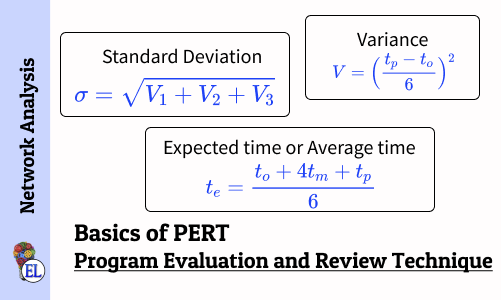
Basics of Program Evaluation and Review Technique (PERT)
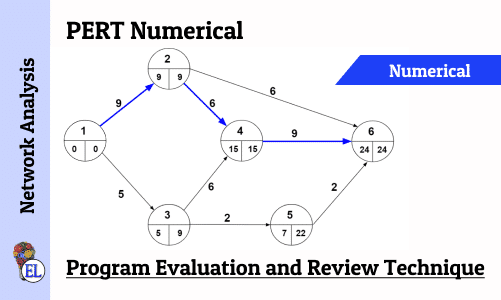
Numerical on PERT (Program Evaluation and Review Technique)

Network Analysis - Dealing with Network Construction Basics
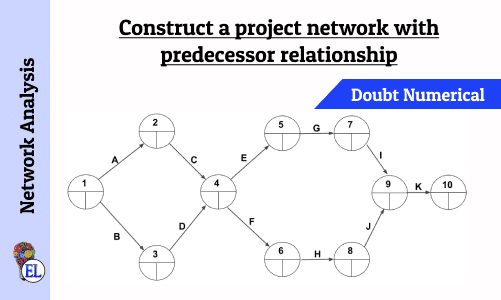
Construct a project network with predecessor relationship | Operation Research | Numerical
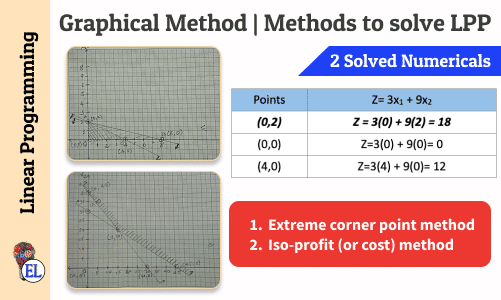
Graphical Method | Methods to solve LPP | Linear Programming
Basics of Linear Programming

Linear Programming Problem (LPP) Formulation with Numericals
Suggested Notes:
Modified Distribution Method (MODI) | Transportation Problem | Transportation Model
Stepping Stone | Transportation Problem | Transportation Model
Vogel’s Approximation Method (VAM) | Method to Solve Transportation Problem | Transportation Model
Transportation Model - Introduction
North West Corner Method | Method to Solve Transportation Problem | Transportation Model
Least Cost Method | Method to Solve Transportation Problem | Transportation Model
Tie in selecting row and column (Vogel's Approximation Method - VAM) | Numerical | Solving Transportation Problem | Transportation Model
Assignment Model | Linear Programming Problem (LPP) | Introduction
Crashing Special Case - Indirect cost less than Crash Cost
Basics of Program Evaluation and Review Technique (PERT)
Numerical on PERT (Program Evaluation and Review Technique)
Network Analysis - Dealing with Network Construction Basics
Construct a project network with predecessor relationship | Operation Research | Numerical
Graphical Method | Methods to solve LPP | Linear Programming
Basics of Linear Programming
Linear Programming Problem (LPP) Formulation with Numericals
Comments:
All comments that you add will await moderation. We'll publish all comments that are topic related, and adhere to our Code of Conduct.
Want to tell us something privately? Contact Us
Post comment